After years of wandering in the forest without a behind-meter energy model (that doesn't suck)... I now have one. I just used it to prepare energy and money projections for a rad couple in an East Bay house boat. I hope to install a Victron system for them this winter.
My related emails to them will give you a sense of my modeling approach. Here are those emails, verbatim:
Hey house-boat friends,
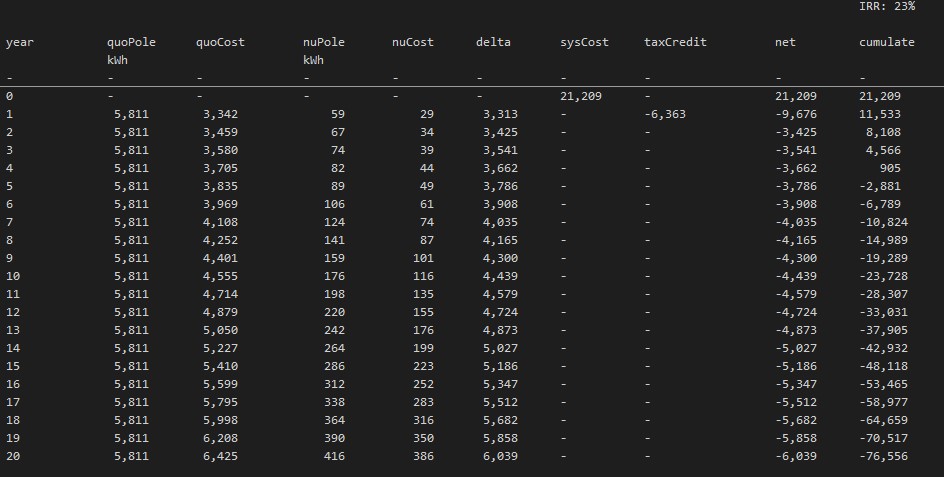
Please see the attached anticipated cost line items, cost estimate, and cash flow over 20 years.
It'd be better if these were PDFs, and better if the field names weren't so cryptic. Please let me know if I can clarify anything.
(My modeling and presentation is a work in progress... I've been neglecting other things so should come up for air now. But, by golly, I believe it's shaping up to be the best behind-meter PV + battery system modeling in the country. Year-2025 Excel is a wildly powerful / flexible / visual calculation engine.)
The smaller / modular Victron batteries are quite a bit more expensive overall than the originally proposed big-box battery. But it's still a strong $ investment... I think it's justified to go all in on one brand (arguably the best brand).
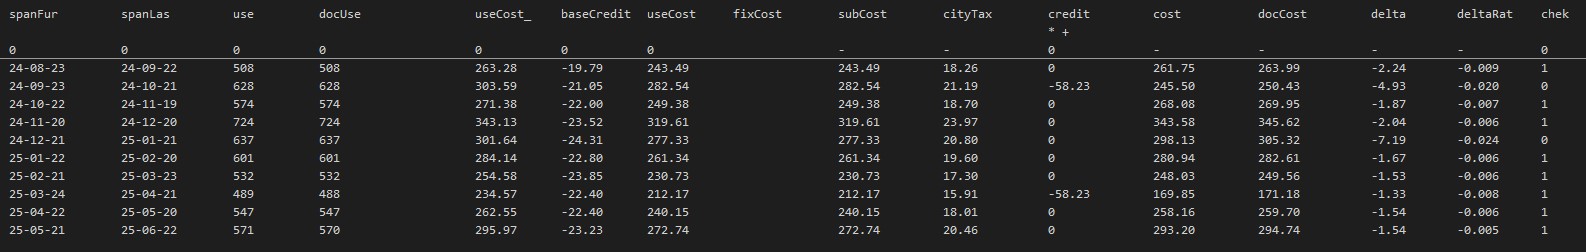
I based the modeling on 10 utility billing periods (see the attached "utility-bill calcs"). For now, I calculated 8 bills within 1% of actual, and 2 within 2.5%.
For PV modeling, I used location-specific historical sunlight + temperature data from NASA. Assuming the (satellite-based / synthetic) NASA data is sound, you could see this as modeling a virtual PV + battery system over the historical period.
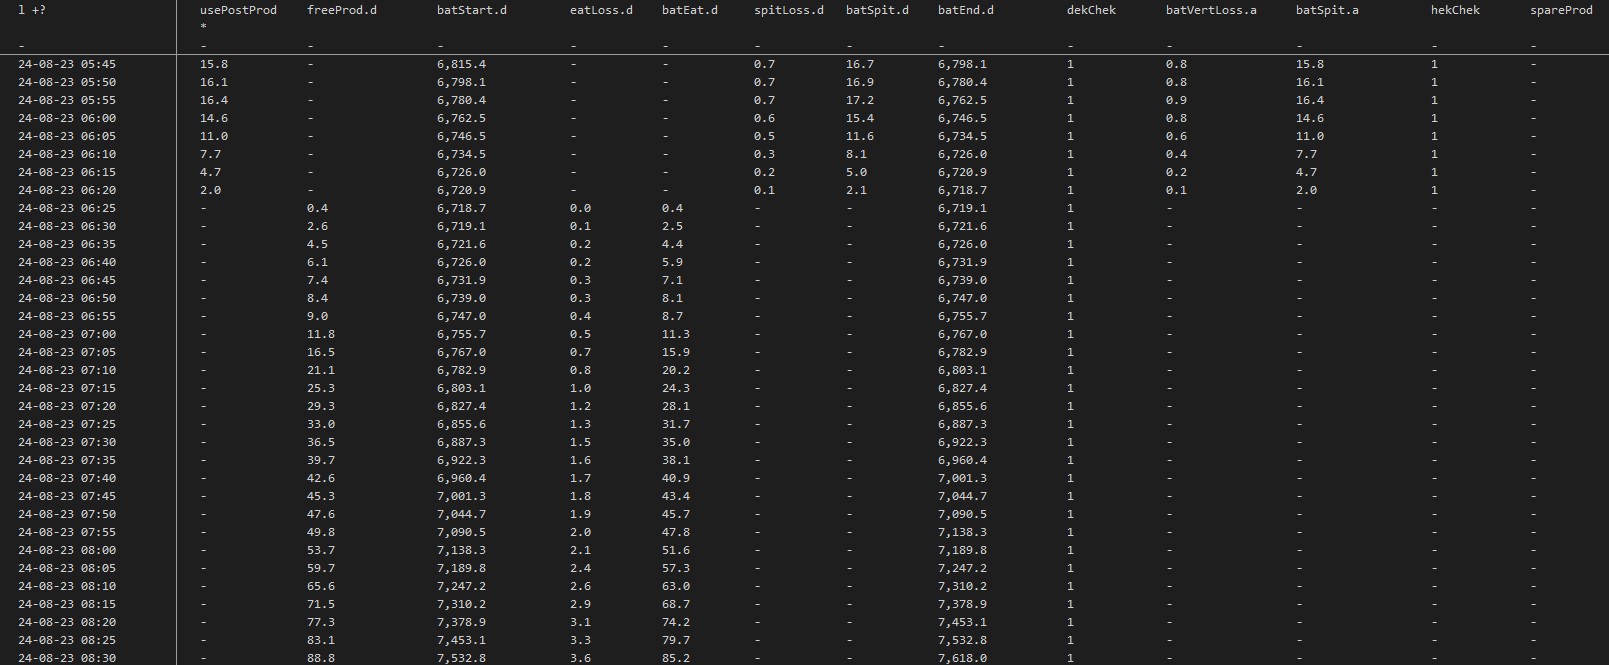
As mentioned during my visit, I disaggregated usage and PV production data into 5-minute intervals using "monotonic cubic Hermite interpolation" (thanks ChatGPT). ...Then did battery modeling on that data set (see the attached example).
Based on 2,000 kWh discharged from the battery bank in the first year, I used a 2.5%-per-year degradation rate (ran the numbers in year 1, 5, 10, 15, 20). Battery capacity is 80% of original in year 10 and 60% of original in year 20.
I have plenty more work to do on the model, but I think the numbers are more-or-less sound.
My kid is home from school today (Yom Kippur). She and her friend are asking to go to the park now. ...I'm scattered at the moment and I hope this email makes sense.
Please let me know if you'd like to review a contract. Otherwise please let me know the next step(s).
Mike
Here are related excerpts from my follow-up email today:
Hey again house-boat friends,
Heads up:
When the grid is down, the Victron system will isolate itself via inverter-based transfer switch.
When the grid is available...
The Victron system will be set to not export to the electric grid. When a large PV/battery-served load (maybe, over 500 watts) is turned off, there could be momentary export to the grid. I think the duration will be too short for grid managers to notice. But it's possible that they will, and that there will be repercussions.
Apparently I can set up the system so that the house boat is normally isolated from shore power (with the exception of ground). ...Only establishing connection when the battery is below a user-defined charge (i.e. "state of charge" >> "SoC") percentage (e.g. 30%). This will prevent momentary exports most of the time.
As mentioned before, the Victron inverters have the UL 1741 listing (for general safety) but not the UL 1741-SB listing — the latter is required for permitted grid interconnection / export.
TMI!:
One thing my modeling doesn't account for yet:
It's my understanding that normally-cycled LFP cells should get to 100% SoC at least once every two weeks (more or less). ...Because cell balancing only happens at 100%, and this calibrates the SoC estimate (for proper system operation). While — according to my model — the battery bank gets to 100% most days outside winter... the 100% days are sparse in winter. See the attached screenshot. I need to learn more here to confirm that this is necessary, but it'll probably be appropriate to schedule some battery-bank top offs in the winter. I think this will increase your grid imports somewhat.
--
I failed to mention that I did a remote shade analysis using the (excellent) indie-developer app ShadeMap (in satellite view, using the drawing feature because it doesn't 3D-model house boats). I assumed the house boat to the west of you is 5' higher (which might be inaccurate... I didn't think to measure during my visit).
--
For the 8 out of 10 bills that were within 1%... the calculated bill was on average $1.73 lower. I'm thinking that's because of a slightly-higher net cost with community-choice aggregation (with Ava Community Energy) . ...I need to separate out the energy-commodity rate from the delivery rate to get to the bottom of this.
Happy weekend.
Mike
Any feedback is super welcome (mike@slowpower.wtf). Especially, please let me know if any errors in my logic or math.
Here are the email attachments.
Too see them big: right click > Open image in new tab
A screenshot of the 5-minute battery charge and discharge modeling:
A screenshot of the utility-bill calculations:
A screenshot of the projected cash flow over 20 years: